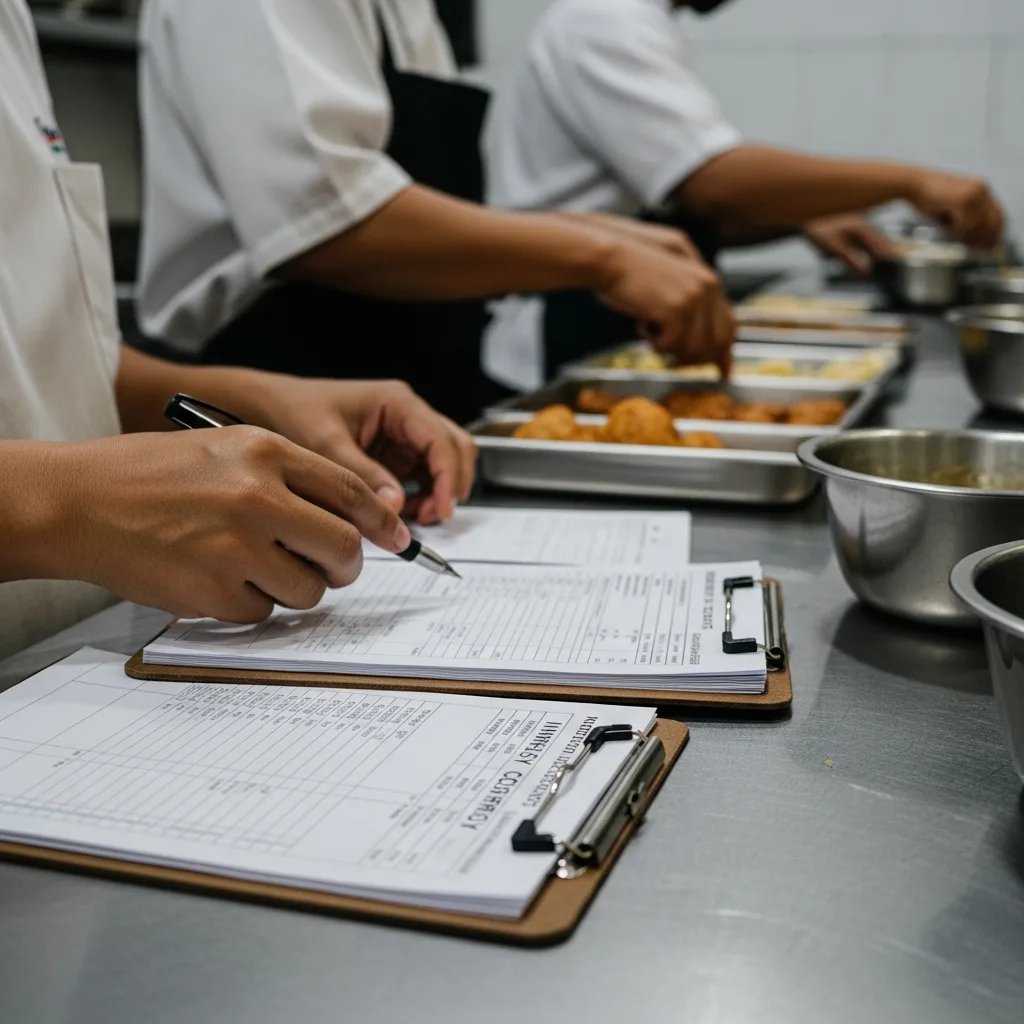
What you will get from this page
Compare recorded usage with recipe expectations, price the waste log and test a focused change without quietly reducing portions.
Measure before you cut
Separate theoretical food cost (recipes × sales mix) from actual food cost (purchases adjusted for inventory). Without both numbers, you cannot tell whether the problem is recipe design, theft/waste, or purchasing price.
Lock recipes and portions
Standard recipes with weights — not “a handful” — and plating photos reduce silent portion inflation. Train the pass to reject plates that do not match the standard.
Attack waste with logs, not blame
Track prep waste, spoilage, and returns for two weeks. Patterns usually point to over-prepping, poor FIFO, or menu items that do not sell.
Purchasing and receiving
Compare invoices to quotes, check weights on delivery, and limit who can approve substitutions. Supplier review belongs in a full operational assessment when variance stays high.
Put the guide to work
Find the waste you can measure
Compare recorded usage with recipe expectations, price the waste log and test a focused change without quietly reducing portions.
All amounts below are invented weekly figures in IDR. They explain a method and are not a savings forecast, service price or industry benchmark.
- Sample actual food cost
- 35%
- Recipe-based expectation
- 32%
- Usage gap to investigate
- IDR 2.4M
1. Establish a like-for-like baseline
The gap can include counting errors, changed purchase prices, yield, portions, waste or unrecorded meals. A waste log explains only the part you actually observe.
On smaller screens, scroll the table to see every column.
| Measure | Amount | How to read it |
|---|---|---|
| Food sales for the week | IDR 80,000,000 | Use the same sales basis when comparing weeks. |
| Actual food used | IDR 28,000,000 | Purchases adjusted for opening and closing stock. |
| Recipe cost of items sold | IDR 25,600,000 | Standard recipe quantities multiplied by actual sales mix. |
| Difference | IDR 2,400,000 | 3 percentage points of sales; investigate rather than assume the cause. |
2. Put a cost beside each waste reason
On smaller screens, scroll the table to see every column.
| Item and quantity | Unit cost | Logged cost | First test |
|---|---|---|---|
| Herbs spoiled: 3 kg | IDR 60,000/kg | IDR 180,000 | Reduce the next order to the measured usage. |
| Cooked rice left over: 5 kg | IDR 18,000/kg prepared | IDR 90,000 | Prepare smaller batches matched to bookings. |
| Sauce discarded: 6 litres | IDR 45,000/litre prepared | IDR 270,000 | Review the batch quantity against sales. |
| Total recorded waste | Not applicable | IDR 540,000 | Keep the reasons separate so changes can be tested. |
- Use the recipe cost for prepared food. A kilogram of cooked rice does not have the same cost as a kilogram of dry rice.
- Separate unavoidable trim from avoidable spoilage. A higher waste weight can sometimes come from a change in the menu mix.
- Record staff meals and complimentary items consistently so they are not confused with unexplained loss.
3. Set a test you can verify
If half of this recorded waste were avoided, the arithmetic is IDR 270,000 less food used. With unchanged sales, that would move food cost from 35% to about 34.66%. It would explain only part of the IDR 2.4M gap, so the remaining difference still needs investigation.
- Choose one action, one owner and one review period. Record both waste quantities and purchase prices again.
- Check portions, guest feedback and availability during the trial. Moving the problem into smaller portions or stock-outs is not cost control.
Your next step
Start with the largest avoidable waste cost in the log. Compare the next equivalent period using the same counting units and sales basis.
Related commercial service
Consulting and Kitchen Audit
Review your costs, team, suppliers and kitchen routines. Get a clear plan for what needs to improve first.
FAQ
Quick answers
Short clarifications so you can decide the next step faster.
Still deciding?
Send your date, guest count and villa area — we reply within 1 hour with a fixed quote.