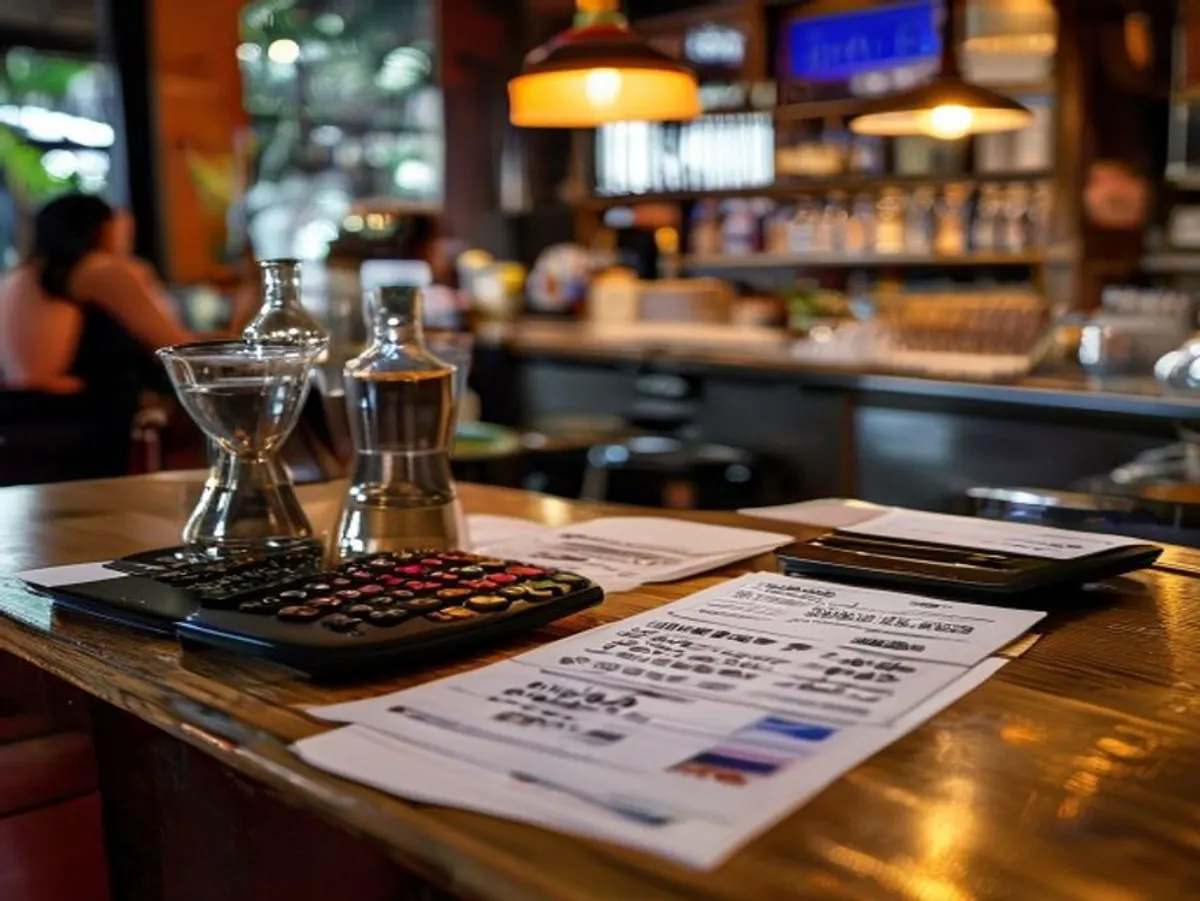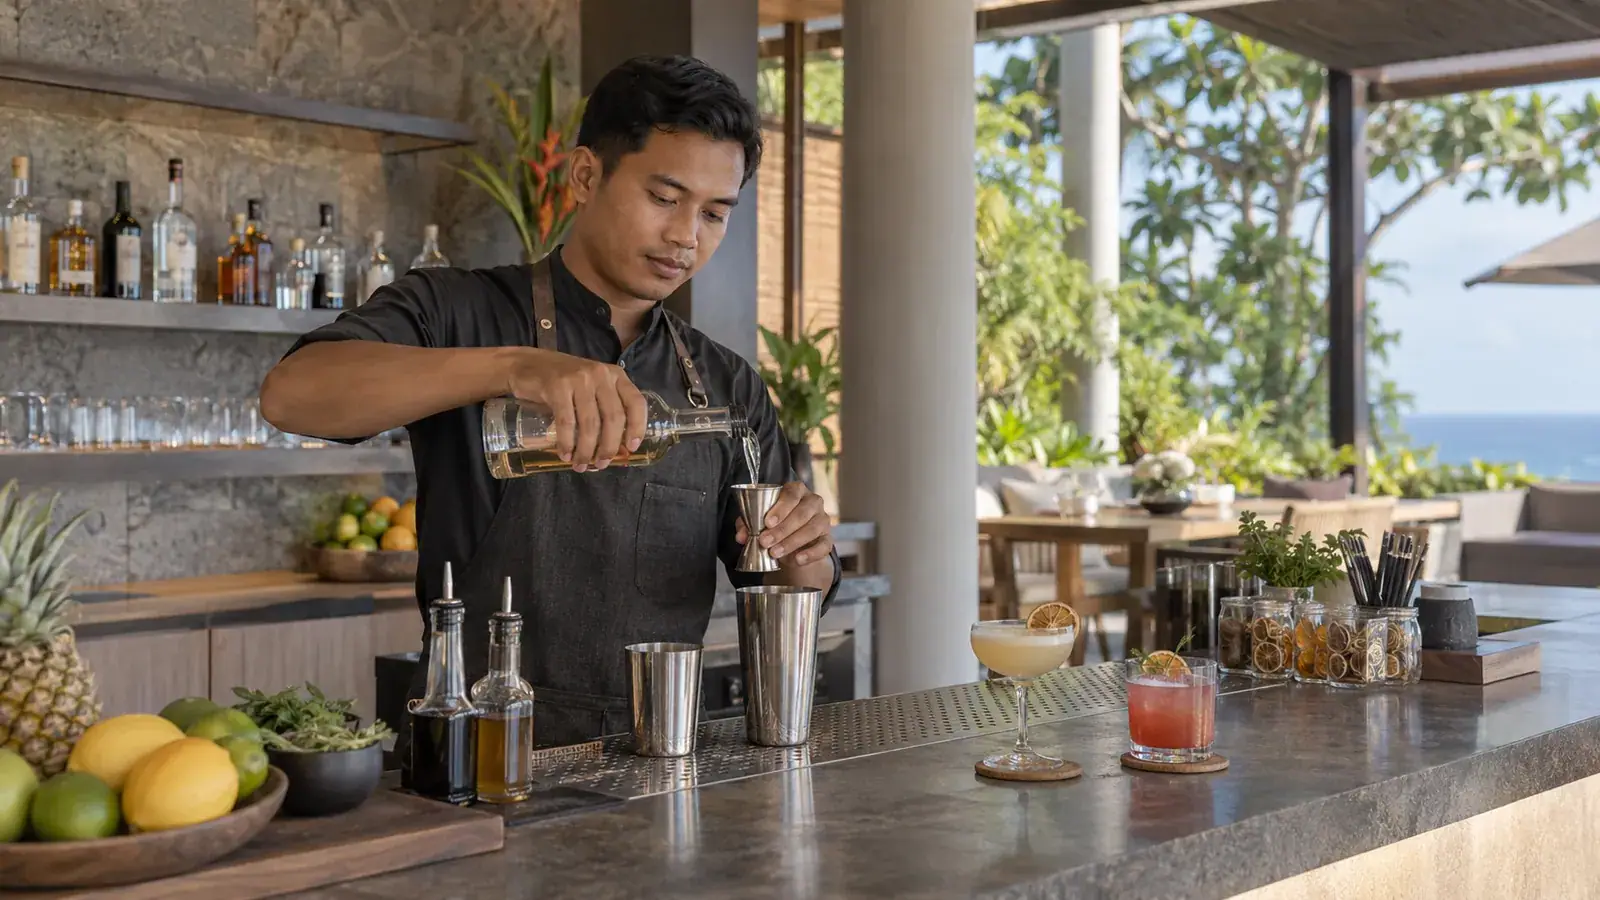
What beverage cost percentage is, the common target band, how shrinkage erodes it, and the controls that bring it back in line.
What is beverage cost percentage?
Beverage cost percentage, also called pour cost, is the ratio of what you spend on beverage ingredients to what you sell them for. The formula is simple: divide the cost of the ingredients in a drink by its selling price, then multiply by 100. A drink that costs a small fraction of its target sell price in ingredients might have a 20% beverage cost.
You can measure it per drink, per category or across the whole bar. Category-level measurement is usually the most useful because beer, wine, spirits and cocktails behave differently.
The common target band
For most Bali bars, a healthy beverage cost percentage sits between 18% and 24%. Beer and wine often run lower, while craft cocktails with fresh produce and premium spirits can run higher but should be balanced by high-margin, batchable options.
If your overall pour cost is above 26%, you are likely leaving money on the table. If it is below 15%, check whether your prices are too high for the market or whether your recipes are being followed consistently.
How shrinkage erodes pour cost
Shrinkage is the gap between theoretical cost and actual cost. Typical sources include over-pouring, spillage, comps, voids, unrecorded staff drinks, theft and bottle giveaway. In Bali, bars commonly lose a significant share of inventory value to shrinkage before the first guest is served.
Shrinkage does not usually show up in your POS. It shows up when your monthly stocktake reveals bottles that disappeared without matching sales. Without measurement, you cannot fix it.
Controls that bring pour cost back in line
Start with recipe costing cards for every menu item, measured to the millilitre. Train staff to free-pour or jigger to spec. Run weekly spot counts and a full monthly stocktake. Set variance tolerance bands and investigate anything outside them.
Next, tighten your comp and void policy, lock storage areas, schedule inventory counts, and benchmark suppliers across at least three licensed distributors. A disciplined system typically pulls pour cost into the 18–24% band within 60 days.
Using pour cost to price drinks
Target pricing works backwards from your desired pour cost. If a drink costs you 22% of the target sell price in ingredients, then your menu price is roughly the ingredient cost divided by 0.22. Round to a price-ladder point that fits your guest profile.
Do not price only by competitor comparison. A competitor may have lower rent, different supplier terms or a higher-volume model. Your own numbers should drive the final decision.